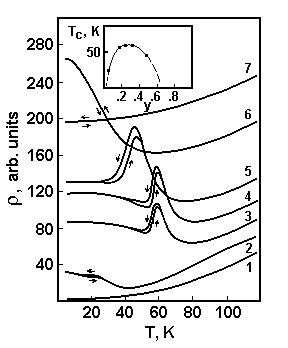
 Fig. 1. Temperature dependence of resistivity R(T) for
Pb0.8Sn0.2Te1-ySey samples.
1 - y=0, 2 - y=0.05, 3 - y=0.25, 4 - y=0.33, 5 - y=0.5, 6 - y=0.67, 7 - y=0.83.
Curves 3-7 are shifted up by 35, 55, 75, 130, and 165 units, respectively. All
samples are of n-type. Arrows indicate the direction of temperature change
during recording the curves. The insert shows the dependence of Tc
on y.