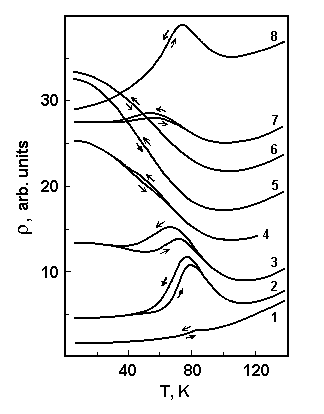
 Figure 1. Temperature dependence of resistivity for
(Pb0.975Ge0.025Te)1-z(Pb0.96Ge0.04Se)z
samples. 1, z=0; 2, z=0.42; 3, z=0.57; 4, z=0.67; 5, z=0.77; 6, z=0.86;
7, z=0.94; 8, z=1 /12/. The curves were arbitrary shifted along vertical axis.
The arrows show the direction of temperature change during recording the
curves.